When senior managers ask a department to show how it contributes to business performance, the conversation usually drifts toward numbers, results and proof. For people professionals, that request can feel slightly uncomfortable at first. HR work has traditionally been described in terms of relationships, judgement and experience. Yet modern practice, particularly within the framework of the Chartered Institute of Personnel and Development (CIPD), places increasing weight on something a bit more structured: evidence-based practice.
This is exactly the space where the learning from CIPD Level 5 becomes very practical. The unit CIPD 5CO02 Evidence-Based Practice asks people practitioners to step beyond instinct and rely on credible information when making decisions about people, performance and workplace practices. In particular, AC2.1 to AC2.3 encourage students to examine both quantitative analysis and qualitative analysis, not as abstract academic ideas but as tools that help HR professionals understand what is actually happening inside organisations.
Still, when students first approach the assignment, the terminology can feel a little intimidating. Quantitative analysis sounds mathematical. Qualitative analysis sounds theoretical. In practice, they are simply different ways of looking at workplace information. Numbers might reveal patterns in employee turnover or absence. Conversations, interviews or feedback surveys might tell a deeper story about morale, workload or leadership behaviour. One without the other rarely tells the full story.
Evidence-based practice (EBP) in HR sits somewhere between data and professional judgement. A people practitioner may review workforce metrics, study academic research, consider organisational context and then weigh these against their own experience. None of these sources alone are enough. Together, they begin to form a more dependable picture.
Within the CIPD 5CO02 – AC2.1 – AC2.3 Practice Guide, the emphasis often falls on the process of analysing workplace information so that HR recommendations carry credibility when presented to senior leaders. A report that only shares opinions rarely travels far in management meetings. A report that combines data trends, employee feedback and reference to established research tends to gain more attention. Perhaps that is the real shift taking place in modern HR practice.
Students working through CIPD assignments frequently discover that the same thinking also appears in more advanced qualifications. At CIPD Level 7, units such as 7CO02 Evidence-Based Practice, 7HR02 Resourcing and Talent Planning, and 7OS01 Work and Working Lives in a Changing Business Environment expect practitioners to evaluate workplace evidence with even greater scrutiny. The underlying principle remains similar though. Decisions about people should be informed by credible information rather than assumption.
So the purpose of this practice guide is fairly straightforward. It reviews how quantitative and qualitative analysis support evidence-based HR practice, especially within the requirements of AC2.1 to AC2.3. The discussion also connects these analytical approaches to the everyday work of people practitioners. Because in reality, data analysis in HR rarely happens inside textbooks. It happens in reports, meetings, employee surveys, exit interviews, and sometimes messy spreadsheets that tell a story slowly, piece by piece.
Section Two – Analysis Questions AC2.1 – AC2.3
5CO02 – AC2.1 – AC2.3 Practice Guide
Scenario
Your manager has just returned from the monthly Senior Management meeting where all departmental heads have been asked to present a report that showcases how they contribute to business performance. As someone with experience in evidence-based practice and data analytics, she asked if you would produce a report for Senior Management explaining evidence-based practice and its relevance to people professionals. She would also like you to include practical examples of the types of data analysis that people practitioners use to gain insight into people’s practices.
In readiness for this, you must complete a report comprising two sections.
Section Two – Quantitative and Qualitative Analysis Review
For section two, you must provide a quantitative and qualitative analysis review using the two data sets.
Firstly, review the Equality, Diversity, Inclusion, and Salary data that is presented in Table 1 and provide an analysis of it to show the following:
- Percentage of each gender by type.
- Ethnicity as a percentage per team.
- Disability percentage as an organisational whole and by teams.
- Salary difference across genders.
- Overall average salary paid by the organisation.
Present your findings using appropriate diagrammatical forms and make justifiable recommendations based on your evaluations.
Table 1 – Equality, Diversity, and Inclusion Salary Data
Secondly, Table 2 gives the rating feedback scores for a sample of 300 employees taken from a recent survey on hybrid working practices. Provide scrutiny of the applied scores, present written commentary on any themes or patterns that might be occurring, and present recommendations based on your findings.
Table 2 – Feedback scores from a recent employee survey on hybrid working practices
Completion of the above two activities will address the following ACs:
Interpret analytical data using appropriate analysis tools and methods concerning a people practice issue. (AC 2.1)
Sample Response (AC 2.1)
Out of the 260 employees sampled for the study, 140 were male, 118 were female, and 2 were non-binary employees. The most dominant ethnic group of the company is the white British employees, who make up 91.15% of the employees, followed by white others (1.92%) and Indian employees (1.54%). The lowest employee ethnicities were Bangladesh Asians and other mixed races (0.38%).
The company has only 29 disabled employees, with the majority of 239 employees having no known disabilities. The property team had the highest number of disabled employees at five, followed by customer services, which had three disabled employees. Business services, Directors, Facilities, Governance, Marketing, Regeneration, and Supported housing departments had no disabled employees as shown below.
| Departments | Disabled | Not disabled | Grand Total | |
| Business Services | 9 | 9 | ||
| Community Engagement and Partnerships | 1 | 6 | 7 | |
| Customer Services | 3 | 12 | 15 | |
| Directors | 5 | 5 | ||
| Facilities | 2 | 2 | ||
| Finance | 2 | 8 | 10 | |
| Governance | 3 | 3 | ||
| Green Spaces | 1 | 11 | 12 | |
| Housing | 2 | 16 | 18 | |
| Income Team | 1 | 18 | 19 | |
| IT | 2 | 7 | 9 | |
| Lettings | 1 | 9 | 10 | |
| Marketing | 4 | 4 | ||
| People Services | 2 | 9 | 11 | |
| Property Team | 5 | 94 | 99 | |
| Regeneration | 5 | 5 | ||
| Supported Housing | 11 | 11 | ||
| Tenancy Team | 1 | 10 | 11 | |
| Grand Total | 21 | 239 | 260 | |
Source: Table 1: General Employee Date
The organisation’s total salary spend for the 260 employees stood at $8,256,940. Of this, male employees received $4,453,705, female employees received $3,764,235, and non-binary staff received $39,000.
When considering average pay across different teams, the directors clearly stand out as the highest-paid group, with an average salary of $93,791. This figure is well above the rest of the workforce and reflects the seniority of the roles. The next highest averages were found in IT ($39,766), People Services ($38,126), Regeneration ($36,118), and Finance ($35,759).
At the opposite end of the scale, the teams with the lowest average salaries were Community Engagement at $27,328, Support Teams at $22,863, and Green Spaces at $21,030. These results suggest a significant pay gap across departments, which likely reflects differences in responsibility levels and the types of roles carried out.
| Teams | The sum of Salary FTE | Average of Salary FTE |
| Green Spaces | 252,360.00 | 21,030.00 |
| Supported Housing | 251,500.00 | 22,863.64 |
| Community Engagement and Partnerships | 191,300.00 | 27,328.57 |
| Customer Services | 412,415.00 | 27,494.33 |
| Lettings | 276,650.00 | 27,665.00 |
| Marketing | 112,150.00 | 28,037.50 |
| Housing | 543,500.00 | 30,194.44 |
| Income Team | 576,920.00 | 30,364.21 |
| Property Team | 3,030,800.00 | 30,614.14 |
| Tenancy Team | 343,350.00 | 31,213.64 |
| Governance | 95,000.00 | 31,666.67 |
| Facilities | 67,155.00 | 33,577.50 |
| Business Services | 319,415.00 | 35,490.56 |
| Finance | 357,590.00 | 35,759.00 |
| Regeneration | 180,590.00 | 36,118.00 |
| People Services | 419,390.00 | 38,126.36 |
| IT | 357,900.00 | 39,766.67 |
| Directors | 468,955.00 | 93,791.00 |
| Grand Total | 8,256,940.00 | 31,757.46 |
Present vital findings from people’s practice activities and initiatives for stakeholders. (AC 2.2)
Sample Response (AC 2.2)
The organisation reviewed the impact of introducing hybrid working practices through a survey of 300 employees. The findings indicated a broadly positive response. A significant proportion of staff expressed that they valued the opportunity to work from home, with many strongly agreeing that hybrid working has supported their work–life balance.
Over half of the participants (51%) strongly agreed that hybrid arrangements had improved both their well-being and balance between personal and professional commitments. In addition, 59.3% agreed they felt more connected to the company culture since the adoption of hybrid practices. This suggests that flexible working has not weakened organisational ties but, in many cases, has strengthened them.
Another clear theme was the impact on personal conflict. Many employees strongly agreed that working from home had helped to remove tensions in their lives. Interestingly, 83% of respondents stated they did not miss in-person workplace interactions while working remotely, which indicates a shift in how employees view social connections at work.
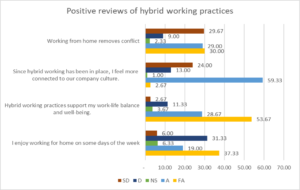
Source: Table 2: Feedback scores from a recent employee survey
Some employees reported that hybrid working had a negative effect on cross-functional communication and collaboration. Many also disagreed with the view that working from home improved their productivity or enabled them to meet their performance targets. A large proportion, 83% of those surveyed, strongly disagreed that working from home made them feel less stressed. This may reflect limited access to organisational support and resources outside the office environment.
Responses were more mixed when it came to specific aspects of home working. On the question of whether productivity improved at home, the results were almost evenly split (49.33% compared with 49.0%). The same pattern appeared regarding access to resources from home (49% versus 49%). When asked about recognition from managers while working remotely, opinions were again divided, with 46.33% agreeing compared with 53% who did not.
Make justified recommendations based on evaluating potential solutions’ benefits, risks, and financial implications. (AC 2.3)
Step 1. Anchor yourself in the brief.
Remind yourself what the question is asking. Here, it’s about interpreting survey results on hybrid working practices, using both numerical evidence and commentary. Write that at the top of your notes so you don’t drift into general discussion.
Step 2. Review the raw numbers.
List all the survey findings in one place. For example:
- 161 strongly agree + 86 agree on work–life balance.
- 148 agree productivity improved.
- 3% reported fewer conflicts, less stress, stronger connection to culture.
- 83% disagreed they missed colleagues.
- 98 strongly agree + 95 agree work/home separation difficult.
- Split opinions on recognition.
Keep both counts and percentages, as it helps you explain results clearly.
Step 3. Group related items into themes.
Cluster your results under clear headings such as:
- Benefits (balance, wellbeing, productivity, culture).
- Risks (teamwork, communication, blurred boundaries).
- Uncertainty (recognition and fairness).
This makes it easier to weave a narrative.
Step 4. Place numbers into sentences.
Translate raw data into natural language. For instance, instead of just “59.3% agreed”, you could write “Around six in ten employees reported fewer conflicts and a stronger sense of connection since hybrid working began.”
Step 5. Balance positives with risks.
Don’t just highlight the good. Comment on potential downsides, like the high percentage struggling with boundaries or the risk of reduced collaboration. Use cautious phrasing words such as suggests, may, could so it feels analytical rather than absolute.
Step 6. Move from findings to recommendations.
Ask: What should the organisation do in response? For each risk, write a recommendation:
- Recognition concerns → create a fair reward system across locations.
- Collaboration challenges → invest in communication tools.
- Work/home blur → train staff on boundary-setting and flexible policy design.
Step 7. Address practical roles.
Remember some jobs can’t be done remotely. Acknowledge this and suggest staffing contingencies so the answer feels realistic.
Sample Response 2.3
Many organisations are adopting hybrid working practices to offer employees the benefits of remote work, greater autonomy, and opportunities for in-person collaboration. Survey findings suggest that these arrangements have helped many employees to balance their work and personal lives. A total of 161 respondents strongly agreed, with a further 86 agreeing, that hybrid working improved their work–life balance and well-being. In addition, 148 employees reported that the model supported their productivity, indicating that flexibility can have a positive influence on both satisfaction and performance.
There were also encouraging signs in relation to workplace culture. Around 59.3% of staff agreed that since hybrid working was introduced, they had experienced fewer conflicts, lower levels of stress, and a stronger sense of connection to the organisation. On the other hand, 83% disagreed when asked if they missed face-to-face interaction with colleagues, which highlights a possible risk to teamwork and day-to-day collaboration. Reduced interaction could, over time, create communication gaps that affect organisational effectiveness.
The survey further revealed challenges in separating work and home life, with 98 respondents strongly agreeing and 95 agreeing that hybrid working blurred these boundaries. Research suggests that such difficulties can lead to lower well-being and an increased risk of burnout. Recognition also emerged as an area of uncertainty: employees were divided on whether they felt equally valued when working from home compared to being in the office. This uncertainty could lead to disengagement. To address this, the organisation would benefit from developing a fair recognition and reward system that applies consistently regardless of working location. Such an approach could help sustain morale and support productivity.
Looking forward, the company may need to strengthen its policies around hybrid working, giving employees flexibility to select the most suitable location based on role requirements and personal circumstances. Investment in appropriate technology will be vital to ensure reliable communication, accurate tracking of working hours, and effective collaboration. Staff should also receive adequate training in the use of these tools to avoid barriers to productivity. At the same time, managers must plan carefully for labour-intensive roles, such as machine operators, mechanics, and janitors, where home working is not practical. Building contingency into staffing arrangements will be essential to maintain operational continuity.
Conclusion
When we step back from the terminology, evidence-based practice in HR is really about asking better questions. Not just what do we think is happening in the organisation? but what evidence suggests this might be true? And then, maybe more importantly, what kind of evidence are we missing?
The requirements within CIPD 5CO02, particularly AC2.1 to AC2.3, push students toward that mindset. Quantitative analysis offers one perspective. Numbers can show patterns that might otherwise go unnoticed. A sudden increase in absence levels, changes in engagement scores or a gradual rise in employee turnover can signal deeper organisational issues. Still, numbers rarely explain the reason behind the pattern.
That is where qualitative analysis begins to matter. Conversations with employees, exit interview responses, focus group discussions or written feedback often reveal motivations and frustrations that spreadsheets cannot capture. When these two forms of analysis sit side by side, something closer to a full picture begins to appear.
People professionals working with senior management often realise this quite quickly. Leaders usually want clear answers, but workplace questions rarely behave that neatly. Evidence tends to arrive in fragments. Some information appears statistical. Some appears narrative. The challenge is learning how to bring these pieces together without forcing certainty where it does not exist.
This way of thinking reflects the wider direction of the HR profession, especially in frameworks promoted by the Chartered Institute of Personnel and Development. Across CIPD Level 5 and CIPD Level 7, evidence-based thinking runs through several units, including 5CO02 Evidence-Based Practice, 7CO02 Evidence-Based Practice, 7HR03 Strategic Reward Management, and 7OS02 People Management and Development Strategies for Performance. Each expects practitioners to question data, examine different sources of evidence and interpret findings with careful judgement.
Perhaps that is the real lesson students take from the CIPD 5CO02 – AC2.1 – AC2.3 Practice Guide. Evidence-based practice is not about turning HR professionals into statisticians. It is about building confidence in interpreting information. Some days the evidence will be clear. Other days it will feel incomplete or slightly contradictory. That is normal.
What matters is that HR recommendations begin with credible information, not assumption. When people practitioners present workforce reports supported by both quantitative data and qualitative feedback, senior management tends to listen more closely. The conversation shifts. Instead of debating opinions, the discussion moves toward understanding what the evidence might be telling us about the organisation and its people.